Available for opportunities

Veeru
Shakya

Data Analyst who turns messy, manual processes into clean automated pipelines — and raw numbers into dashboards that actually get used.

View My Work ↓ Get in Touch
Scroll to explore
01 — About

The analyst
behind the data

I'm Veeru Shakya — a 21-year-old Data Analyst from Gurugram, currently pursuing my BBA while building a career in data full-time.

I got into data analytics with a clear goal: learn a skill that's genuinely in demand and build something real with it. What I didn't expect was how much I'd enjoy the process — especially automating the repetitive stuff. There's something deeply satisfying about replacing hours of manual work with a pipeline that just runs.

My projects reflect that — from ETL pipelines that clean and inject creator data into PostgreSQL, to Power BI dashboards that give stakeholders answers at a glance. I'm not locked into one industry. Good data problems exist everywhere, and I'm here for all of them.

Let's work together →
5+
Projects completed
4
Core tools mastered
ETL
Pipelines built
BI
Dashboard design
02 — Skills

Tools of the
trade

Languages & Querying
Confident
PostgreSQL Python Pandas
Working Knowledge
NumPy Window Functions CTEs
Exploring
Python Automation
Visualization & BI
Confident
Power BI Advanced Excel
Working Knowledge
DAX Power Query KPI Design
Exploring
Matplotlib
Tools & Workflow
Confident
GitHub Jupyter Notebook
Working Knowledge
ETL Design Data Cleaning Google Cloud
Exploring
Airflow

Featured
projects

YouTube Agency ETL Pipeline
01
Data Engineering

YouTube Agency Data Pipeline

End-to-end Python ETL pipeline that cleans YouTube creator financial data and injects it into a secure PostgreSQL database — automating what was once a manual, error-prone process.

Python Pandas PostgreSQL ETL
WITH raw_client_data AS ( SELECT agent_id, month, SUM(revenue) OVER ( PARTITION BY agent_id ORDER BY month ) AS cumulative_revenue, LAG(revenue) OVER ( PARTITION BY agent_id ORDER BY month ) AS prev_month_revenue FROM agency_data
02
SQL Analytics

Agency Analytics MOM

Advanced PostgreSQL analytics for a YouTube creator agency — extracting actionable business intelligence on audience RPM, recurring sponsor ROI, and month-over-month revenue growth.

PostgreSQL Window Functions MoM Analysis BI
SQL Revenue Growth Pipeline
03
Data Pipeline

SQL Revenue Growth Pipeline

A PostgreSQL data pipeline that cleans unstructured e-commerce sales data and calculates day-over-day revenue growth using Window Functions — turning raw transactions into clear growth signals.

PostgreSQL SQL Window Functions E-commerce
HR Attrition Analytics Dashboard
04
Business Intelligence

HR Attrition Analytics

Power BI HR dashboard diagnosing a 16% employee attrition rate across 1,470 records — identifying flight risks by salary, job role, and tenure to give HR leadership a clear retention roadmap.

Power BI DAX HR Analytics Statistics
Superstore Sales Dashboard Superstore Sales Forecast
05
Dashboard

Superstore Sales Dashboard

Interactive Power BI dashboard analyzing e-commerce revenue, featuring 15-day sales forecasting, supply chain KPIs, and customer segmentation — giving stakeholders a live pulse on business performance.

Power BI Forecasting KPI Design Segmentation
04 — Case Study

How I built the
YouTube ETL Pipeline

YouTube Agency ETL Pipeline
Type
End-to-end ETL Pipeline
Stack
Python · Pandas · PostgreSQL
Duration
Solo project
01 — The Problem

A creator agency drowning in spreadsheets

YouTube creator agencies manage revenue across dozens of creators — Adsense payouts, sponsor deals, agency fees. When all of that lives in raw CSVs, someone has to manually clean and consolidate it every single month.

The data was messy: missing revenue values, inconsistent formatting, null sponsor entries, duplicate rows. It wasn't analysis-ready — it needed hours of manual work before anyone could even ask a business question.

The goal was simple: eliminate that manual work entirely and deliver a clean, structured dataset straight into a database where it can be queried immediately.

02 — My Approach

Think before you code

Before writing a single line, I mapped out the three phases the pipeline needed to handle:

1
Ingestion — read raw creator CSVs reliably, regardless of formatting inconsistencies
2
Cleaning — handle nulls intelligently (zero for numeric fields, "No Sponsor" for missing brands), strip whitespace, standardise types
3
Loading — inject the clean data into PostgreSQL in a way that's repeatable and safe to run multiple times
03 — What I Built

A three-phase Python pipeline

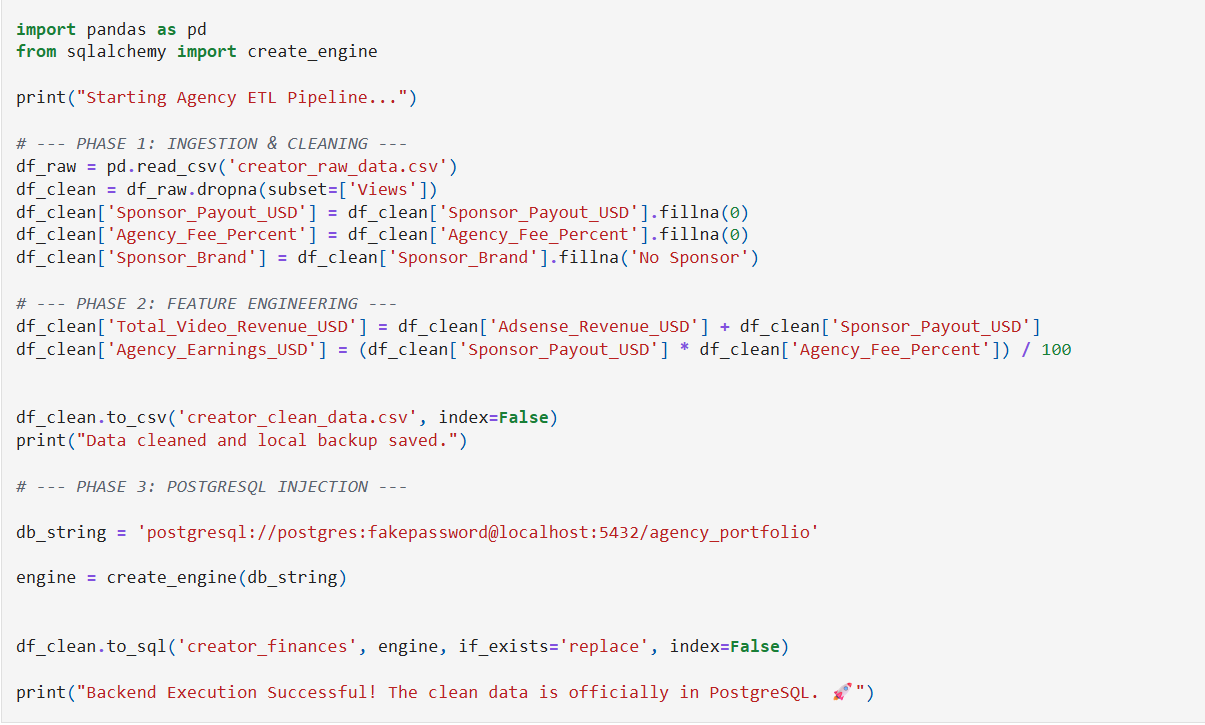
The core logic across all three phases looked like this:

# Phase 1 — Ingestion df_raw = pd.read_csv('creator_raw_data.csv') # Phase 2 — Cleaning df_clean = df_raw.dropna(subset=['Views']) df_clean['Sponsor_Payout_USD'] = df_clean['Sponsor_Payout_USD'].fillna(0) df_clean['Sponsor_Brand'] = df_clean['Sponsor_Brand'].fillna('No Sponsor') df_clean['Total_Revenue'] = df_clean['Adsense_Revenue_USD'] + df_clean['Sponsor_Payout_USD'] # Phase 3 — Load into PostgreSQL engine = create_engine(db_string) df_clean.to_sql('creator_finances', engine, if_exists='replace')

The feature engineering step was the most valuable addition — computing Total_Video_Revenue_USD and Agency_Earnings_USD meant downstream queries didn't need to recalculate these every time.

04 — Challenges

What didn't go smoothly

!
Null handling strategy — not all nulls mean the same thing. A null sponsor payout means £0, but a null view count means the row is invalid and should be dropped. Getting this logic right was critical.
!
Database connection security — the pipeline needed to handle connection failures gracefully and never expose credentials in the codebase.
!
Idempotency — using if_exists='replace' meant the pipeline could be safely re-run without duplicating data.
05 — Results

What it delivered

~0
Manual hours per month
3
Revenue streams tracked
100%
Repeatable & automated

The pipeline replaced what was previously a manual monthly process. Data now lands in PostgreSQL clean, typed correctly, and ready for any downstream query or dashboard to consume immediately.

06 — What I Learned

The real lesson

The technical skills — Pandas, SQLAlchemy, null handling — were learnable. The bigger lesson was about thinking like an engineer before thinking like an analyst.

A good pipeline isn't just one that works once. It's one that works every time, fails clearly when something goes wrong, and doesn't need someone to babysit it. That mindset shift — from "does this produce the right answer?" to "is this production-ready?" — is what this project taught me most.

05 — Resume

Experience &
credentials

Full resume with detailed project breakdowns, technical skills, and contact info — ready to share with hiring managers.

Download Resume ↓
Location Gurugram, India
Remote Open to remote globally
Phone +91 82870 99581
Status Available immediately
Emailveerubusiness77@gmail.com
Professional Summary

Data Analyst with hands-on experience building end-to-end SQL pipelines, Python ETL systems, and Power BI dashboards that turn messy data into clear business decisions. Combines technical depth with commercial thinking — backed by a BBA — to bridge the gap between raw data and real ROI.

Technical Skills
Databases & Querying
PostgreSQL — Window Functions, CTEs, Complex Joins, Aggregations, CASE
Programming
Python (Pandas, NumPy) — EDA, data cleaning, automation & ETL pipelines
Data Visualization
Power BI (DAX, Power Query), Microsoft Excel (Advanced)
Cloud & Tools
Google Cloud (Data Transformation), Jupyter Notebook, GitHub
Key Projects
E-Commerce Revenue Growth Pipeline
  • Built a PostgreSQL pipeline that ingested and cleaned unstructured e-commerce sales data across 10,000+ records
  • Engineered day-over-day revenue growth metrics using Window Functions, enabling trend detection and anomaly flagging
  • Delivered a query-ready dataset reducing ad hoc reporting time by an estimated 70%
YouTube Creator Agency ETL Pipeline
  • Developed an end-to-end Python ETL pipeline using Pandas to ingest raw creator financial CSVs and fix formatting errors
  • Automated data injection into a secure PostgreSQL database, replacing hours of manual wrangling with a repeatable pipeline
  • Pipeline adopted for tracking Adsense revenue, sponsor payouts, and agency fee metrics across multiple creator accounts
HR Attrition Analytics Dashboard
  • Built an interactive Power BI dashboard diagnosing a 16.12% attrition rate across 1,470 employee records
  • Surfaced key insight: Laboratory Technicians and employees earning under ₹5K were highest flight-risk cohorts
  • Featured KPI cards, donut charts, trend lines, and a job-role attrition matrix for executive-level reporting
Agency Month-over-Month Revenue Analytics
  • Designed advanced PostgreSQL analytics extracting BI on audience RPM, recurring sponsor ROI, and MoM revenue growth
  • Implemented complex window functions and CTEs to surface period-over-period performance across multiple revenue streams
Education
Bachelor of Business Administration (BBA)
Gurugram University, Gurugram, India — In Progress
Certifications
SimplilearnIntroduction to Data Analytics
AnthropicClaude 101 — Accurate Prompting
SkillUP · SimplilearnExploring Data Transformation with Google Cloud
06 — Contact

Let's build
something great

Open to data analyst roles, freelance projects, and interesting collaborations.

veerubusiness77@gmail.com